September 18, 2024
Effective workflows are often the key to a smooth and productive workday. In this section, we will introduce you to tools for visualizing and improving your workflows. We will show you how to gain better insight into different workflows in your Perfion system using the Dashboard feature.
With IT investments, it is never enough to "just" buy the license, install your software, and continue working as you always have—at least not if you want to get full value for your money.
Our experience tells us that IT investments rarely yield significant returns unless the people working with the system actively adapt to life with a new tool in hand.
In this context, Perfion’s Dashboard tool can be a simple yet effective instrument to shed light on the processes you have in your work with product data.
With Dashboards, you as users can quickly create and customize easy-to-read visual charts that provide an overview of data quality and completion rates in your PIM system. The business value of a feature like Dashboards lies, among other things, in making the invisible visible. Only when you can see and analyze your processes will you become aware of where the biggest savings lie.
In your work to present the best product data to your end users, dashboards can also help you achieve faster time-to-market, gain insight into the processes that are “lagging,” and more easily prioritize your internal tasks.
Mini-case: Pagunette Makes the Ordering Process Easier to Manage for Dealers
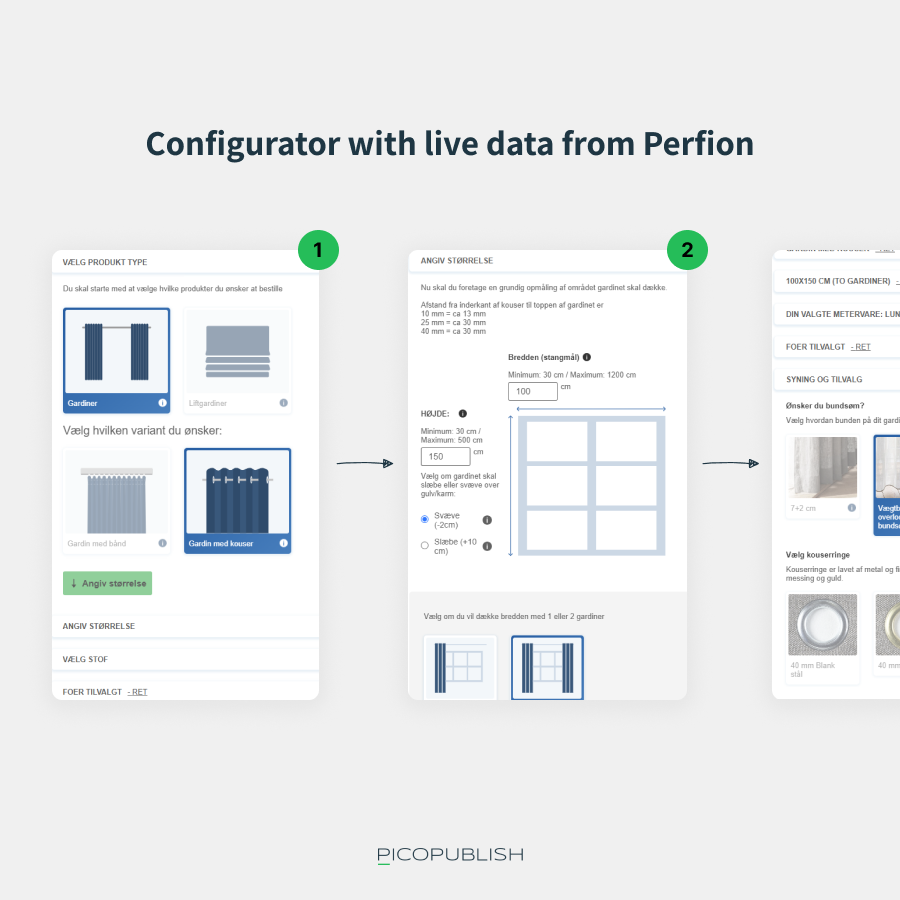
As an outro to this article, we will briefly present another visualization tool—namely, the configurator. Configurators are often effective tools for making the purchase and sale of complex products simpler.
At Pagunette, for example, they have built a configurator that makes customizing a curtain order simple, which benefits Pagunette, their dealer network, and end users alike. Pagunette experiences fewer ordering errors. Dealers can more easily help customers order the right product. Customers receive visual assistance with the customization options that Pagunette offers—a win/win/win.
And these are just a few of the benefits Pagunette has gained by developing and offering their dealer network a tailored product configurator. Additionally, there is the possibility to reduce inventory of standard products as well as better scaling/rollout of Pagunette’s product package as other gains.
Make your workflows visible so you can improve them
There are two ways to approach working with Dashboards.
You can either choose to map your processes in advance and use dashboards to highlight insights across your product data that support these processes (e.g., “how many products are missing images?”).
Alternatively, you can use Dashboards to monitor data quality and then adjust your processes where you observe the biggest errors and gaps.
How do dashboards help us strengthen our processes?
Dashboards can be a great help when you need to get an overview of the quality of your product data enrichment.
Dashboards are visual tools and can, for example, quickly provide an overview of:
- How many products are missing images
- What percentage of your products are live in your channels
- Which employees have unfinished products
- Completion rates of descriptions across language layers
- And much more
Dashboards are an effective tool to get an overview of your product data and processes, and implementing Dashboards does not require custom development. This means your users can customize the data views they need themselves.
With dashboards, you gain the ability to get real-time insight into your product data, so you can monitor business indicators such as data quality, sales performance, and inventory levels.
This means, among other things, that you continuously get a better sense of the workload in Perfion (e.g., “this many products need enrichment in feature-X”). If you map your processes and workflows in advance, Dashboards can help verify any hypotheses you may have by providing concrete numbers and statistics about your product data.
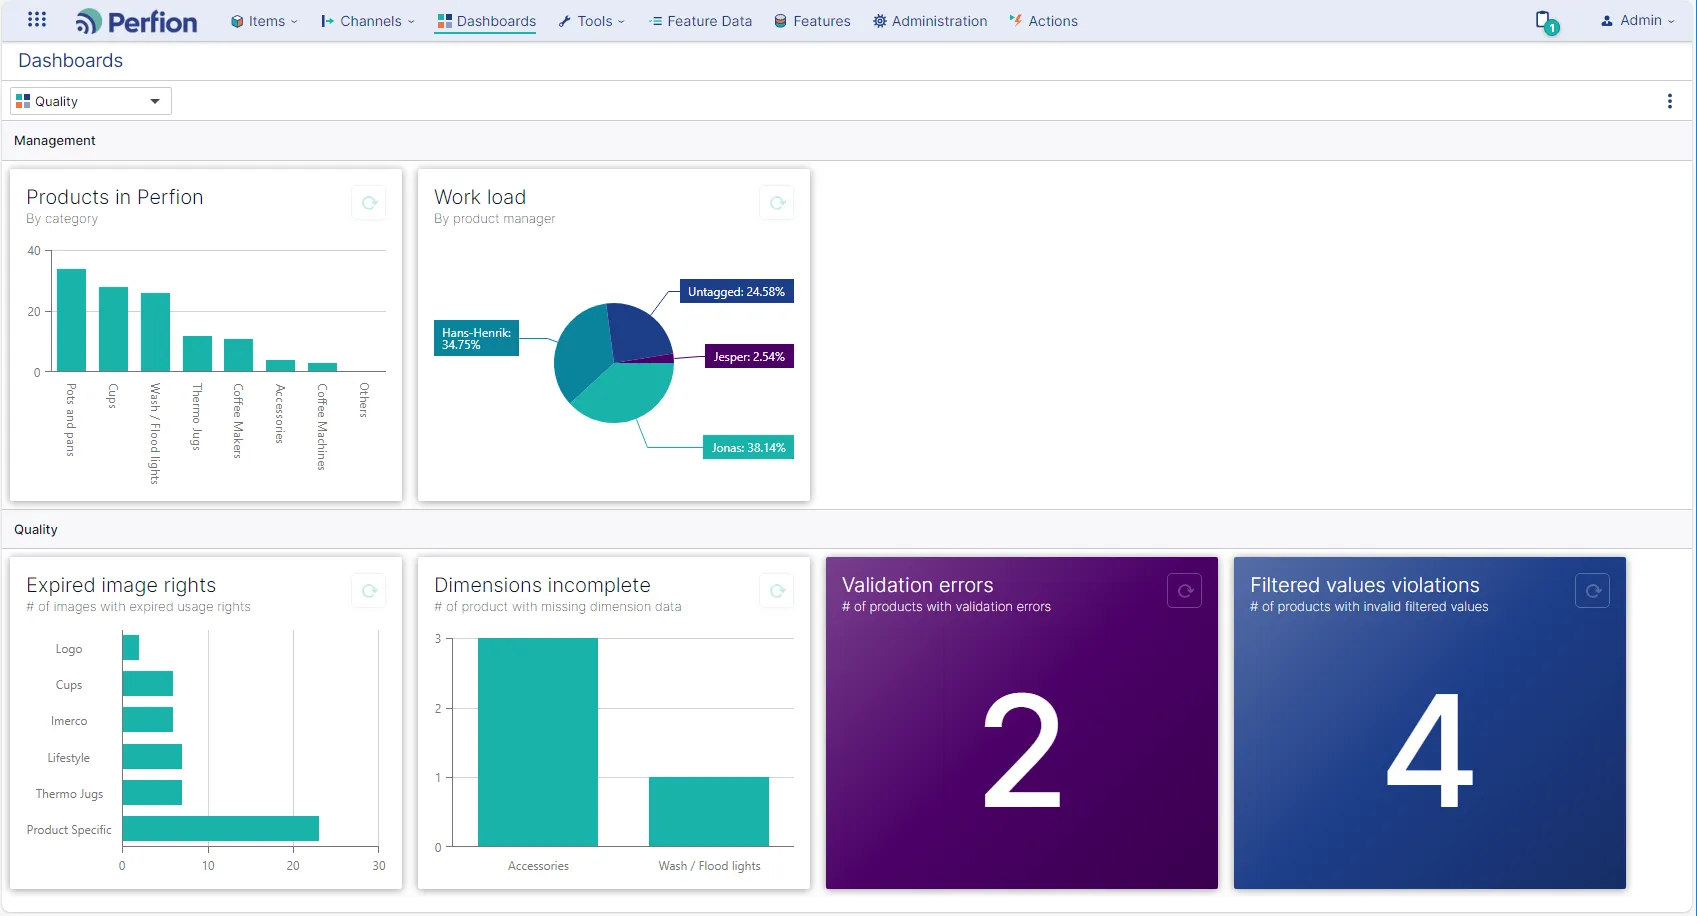
Dashboards reveal both gaps in data quality and processes
An effective dashboard can thus help monitor both the quality of your product data and the efficiency of your internal processes.
For example, you can choose to monitor indicators that show how quickly your product data is processed from creation to publication. This will give you an idea of whether your time-to-market meets your ambition level or if improvements are needed.
Next, the Dashboard feature can be used to monitor the processes or product data that slow down the launch of your products.
For employees in your company, dashboards targeted at observing process-critical factors can provide insights into how best to allocate your resources and improve overall operations.
By using dashboards, you can ensure that you have the necessary overview to make data-driven decisions, improve productivity, and optimize your business strategy.
Would you like to see a live demo of Perfion’s Dashboard feature?
Then contact us for a walkthrough with one of our consultants.
Book a chatCase: Pagunette strengthens the curtain ordering process with a tailored configurator
Most companies we work with experience that the amount of product data to manage increases year after year.
This creates a number of challenges in daily, concrete data handling, but also presents new opportunities to showcase products and product catalogs in new ways to customers—such as allowing users to configure or customize products according to their needs.
What is a "configurator"?
In this context, a configurator is a piece of software that, for example, enables configuring a set of individual components so they form a cohesive whole.
This could be the ability to size a crane so you don’t have to choose between one or more standard models but can instead customize lifting capacity, color, length, and winch for a specific purpose.
A configurator makes it easier for users to get the right product and can, in some cases, reduce the number of products you need to keep in stock, as the configurator enables built-to-order production with minimal waste.
Custom curtains in Pagunette’s dealer network
One of the more extensive configurators we have built is designed for the textile company Pagunette.
Pagunette’s products are sold in multiple countries, where individual dealers now have the opportunity to use a product configurator to build custom curtain orders.
Where Pagunette curtain dealers previously each had their own system to handle curtain orders, Pagunette has now provided dealers with a tailored configurator that makes the process significantly easier.
The configurator is a user-friendly system that allows the dealer to customize a curtain order in collaboration with the customer. Pagunette’s configurator pulls product data live from Perfion and lets the customer tailor the order directly based on the product data.
For Pagunette’s dealer network, this increases accuracy. All data for the configurator is delivered from the PIM, and all orders placed via the configurator simplify the subsequent order flow, as manual processes are eliminated due to the configurator’s precision and customization options.
A premium curtain is almost always customized to the exact measurements requested by the customer. With the configurator, the entire order reception and production startup process becomes easier for Pagunette.
All of this is built on live data from Perfion, ensuring that users always have access to the latest material and product options.